What is the difference between Logging, Tracing & Profiling?
Monitoring our systems & services with different complementary tools to better understand how they behave.
Table of content
With Cloud Computing, visibility into our application is crucial, especially when we talk about containers, microservices and highly distributed systems. While imagining a plane flying without any way to tell how its systems are doing is hard, imagining a fleet or aircrafts flying over cities without any traffic control towers monitoring the all thing is even harder and close to impossible.
From this starting point, we should be able to agree that monitoring is important, because:
- Issues will arise, even with the best applications built by the best engineers
- With distributed systems come distributed failures, which can be devastating when not prepared for and no way to tell where they come from
- It contributes to transparency and accountability
- It reveals mistakes early and offers paths for learning and improvements
With all that said, where should we start and what are the differences between Logging, Tracing and Profiling which are essential parts of how we monitor and create observability into systems?
Logging: taking notes of things happening into a system
Let's start by the most straightforward way of understanding how a system behaves: logs.
A log is a record of events that happened over time: a screenshot of something with an associated timestamp.
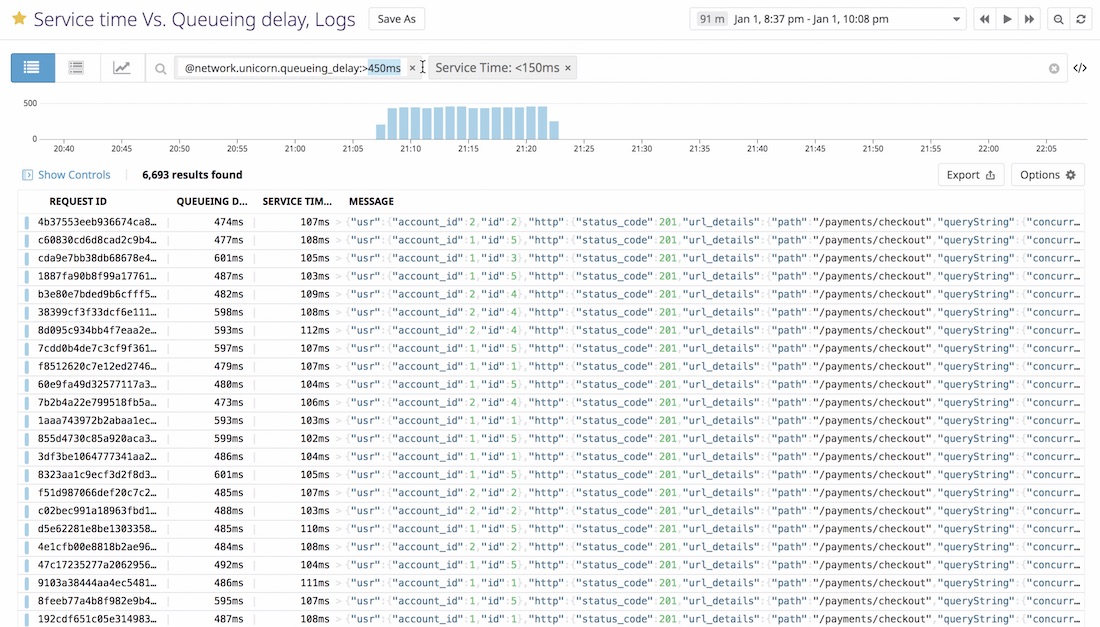
A list of logs displayed in Datadog
A flight manifest is a good example of that principle: we log all passengers and crew members before departing so we know who is in all flying aircrafts at any given time.
In the context of cloud applications, logging can be used to save information about requests (duration, status code, userId), database queries, load balancer usage and more. It gives you precious details when bugs arise to determine the root cause of an outage or performance issue.
While logging everything is tempting, this strategy can be really expensive and ineffective. You need to find the right balance between logging everything and nothing to gain enough context for it to be useful.
Logging consists of multiple steps:
- Collecting & Ingesting: when you generate logs in different services, you need a central place where to send them
- Processing: ingested logs are enriched with metadata & attributes for future use
- Indexing: logs are segmented into groups to generate metrics, patterns and dashboards
With tools like the ELK stack, Datadog or AWS CloudWatch, you can generate powerful insights from huge amounts of logs coming from hundreds of different services.
Digging deeper into Logging
- Learn more about the Elastic stack to collect, aggregate & analyze logs using Elasticsearch, Logstash and Kibana
- See how AWS logging solution, AWS CloudWatch, works
- Read how you can use services like Datadog to collect logs and use them to monitor your application
Tracing: a single user's or request's journey through a system
While per-service logging is a good way of introspecting things, it is not enough to convey the big picture of a request propagating across a distributed system. In a microservices architecture, a request is the result of many interactions between different entities (APIs, databases, queues) which can all be a point of failure.
Tracing acts like the blackbox of an aircraft during a crash: it helps you understand how things went during a crash, to discover the chain of events that led to a problem.
It provides a low-level view to understand:
- what triggered what in the program
- with which arguments
- in which order
- how long did each step lasts
It helps discover performance bottlenecks quickly and find the cause of failures when the occur.
The result of Tracing can be visualized in two ways:
- Traces: it looks like a flame graph with spans and their associated metadata
- Service maps: it looks like a cloud of nodes and links between them to visualize the flow of requests
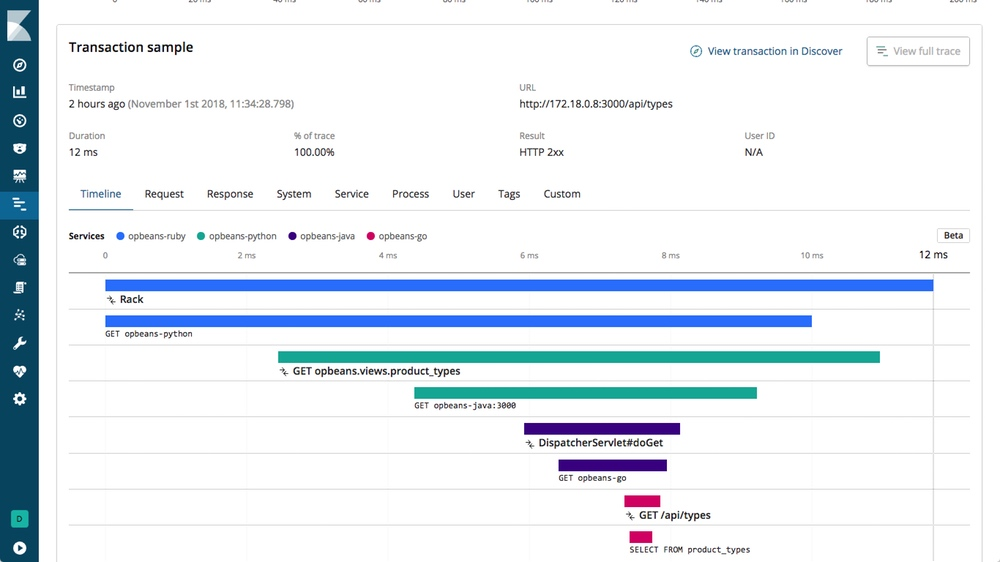
A distributed trace using the ELK stack
With tools like Open Tracing, AWS X-Ray or Zipkin, you can create traces and service maps to provide richer and more relevant context when troubleshooting issues.
Digging deeper into Tracing
- Learn how Uber uses distributed tracing to conquer microservices complexity
- Watch how Lyft integrated and now uses distributed tracing
- Read how Netflix built observability tools to better understand its systems
- Learn more about tools like Open Tracing and Jaeger Tracing
Profiling & Metrics: measure a system's health over time
Profiling and metrics are the last piece of the monitoring puzzle. Together, they provide a statistic overview of a system's health and tracked events over time.
Software profiling helps you create profiles just like profilers in the police. But instead of catching bad guys, you want to catch bad performances.
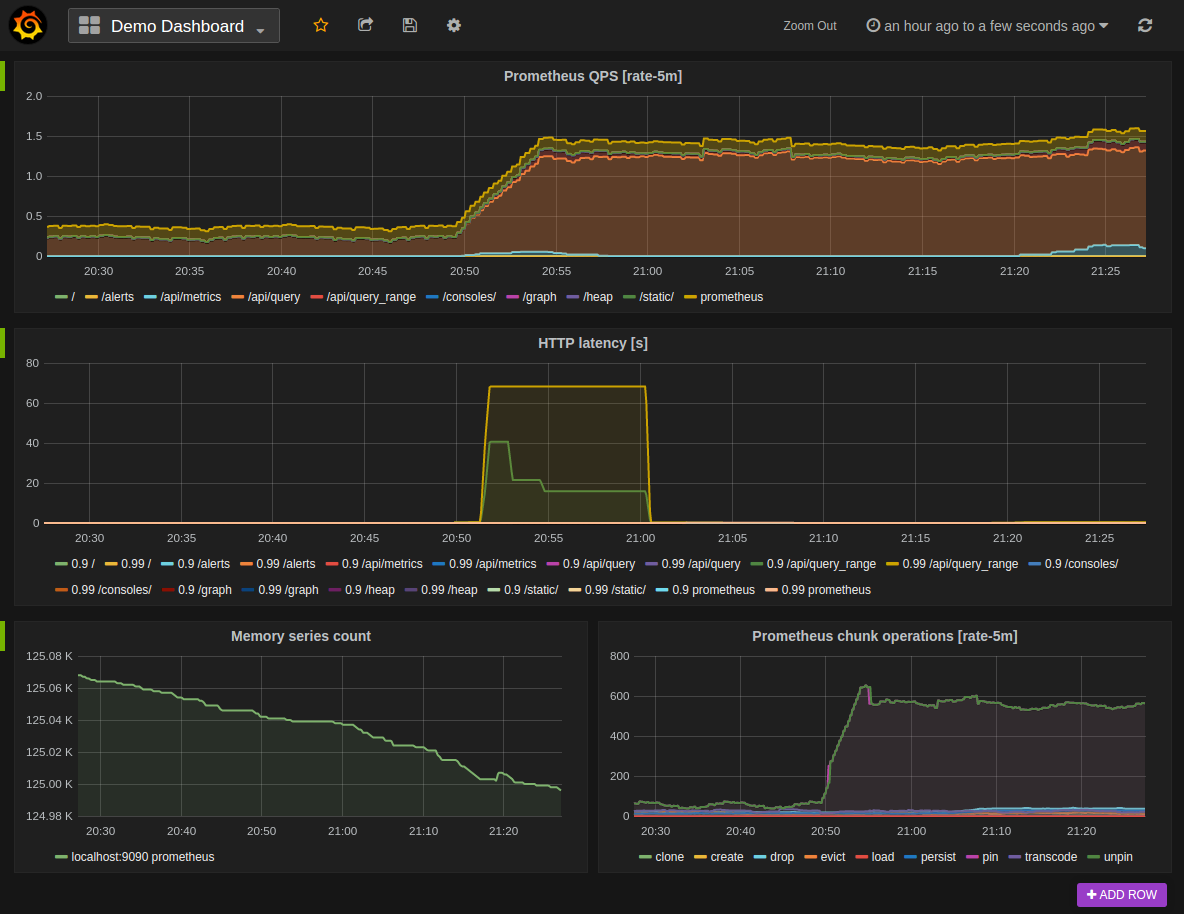
Metrics displayed in Grafana using Prometheus
Profiles range from low-level metrics like CPU usage or file I/O to higher-level metrics like throughput or latency. When aggregated and seen together, they are powerful signals giving you a holistic view of your system and can help detect issues.
Like for logging, it's easy to think that the more metrics you have, the best your monitoring is gonna be. While it is tempting, you want to make sure to measure things that directly affect users of your application to be able to effectively detect and alert engineers when necessary.
With tools like Prometheus, Zabbix or Datadog, you can build profiles and metrics to improve how you monitor your services and underlying infrastructure.
Digging deeper into profiling & metrics
- Learn more about the golden SRE signals as described by Steve Mushero
- Read about Digital Ocean's introduction to Monitoring & Alerting
The bottom line
When used together, Logging, Tracing and Profiling can give you powerful insights about your services and systems: detecting anomalies when they arise and quickly understand the root cause of performance issues.
While monitoring is perfect at answering questions you're already asking yourself about your application, it only works when systems fail in predictable ways. Observability is about going one step further by providing tooling to openly observe and explore systems.